
At a glance
| Client | Vistry Homes |
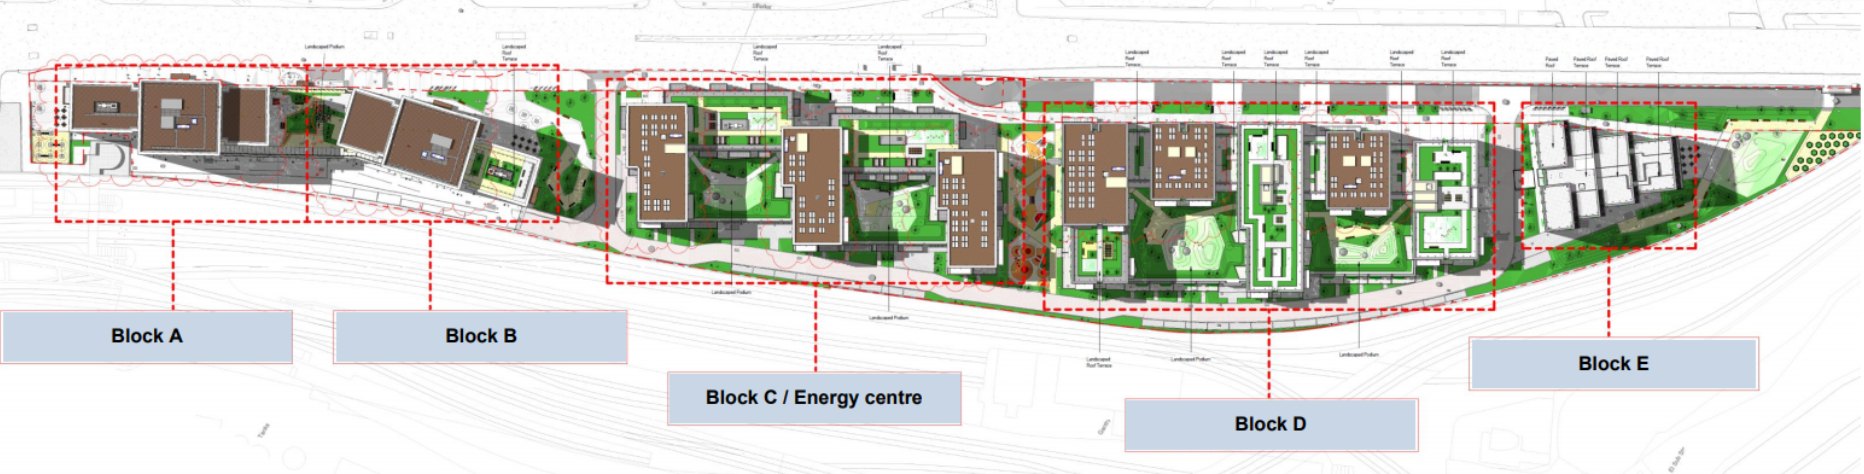
| Network | Brunel Street, Canning Town, London: five blocks (A to E), around 1,000 homes and a hotel |
| Energy centre | Four gas boilers of 2.2 MW, CHP and three buffer stores |
| Our role | Analysis of design and operation, then staged works packages from December 2023 |
| Key works | Remote visibility and alarms, BMS strategy, metering, bypass closure, buffer store reverse return, boiler loading, HIU diagnostics |
| Result | Over 20% energy saving; flow stable at 72 °C ±1.5 °C; network temperature drop up from 6 °C to 16 °C |
The problem
Residents were losing heat and hot water, and the system was running inefficiently. We were asked to investigate the design and operation of the network, report on what we found and put it right. Our analysis, in December 2023, found an energy centre that fell well short of CIBSE guidance and the CP1 Heat Networks Code of Practice, and was not in a fit state for acceptance.
- Boilers two to three times too big. Four 2.2 MW boilers were installed, three able to fire at once, against a December peak of about 1.4 MW, just over half the output of one boiler. They had no loading valves.
- Buffer stores that could not work as stores. The three buffers were piped in parallel without a reverse return, so one charged while another discharged, and none had baffles or sparge pipes to keep the water stratified.
- Controls fighting the plant. A frost protection function brought on three boilers whenever it turned cold, with the buffers already full, driving boiler temperatures towards 100 °C and tripping them. Boilers short-cycled, and there was no pump over-run.
- A BMS that could not be trusted. Graphics did not match the installation, data points were crossed, and some values were impossible, such as secondary temperatures higher than primary.
- Return temperatures almost as high as the flow. Returns were only 6 to 10 °C below the flow, so pumps ran at more than twice their design flow and heat losses were high.
- Oversized pumps and bypasses. The pumps from the substations to the homes could not turn down far enough, and pressure-operated bypasses at the tops of the risers ran continuously, keeping returns high and the riser cupboards hot.
- Metering with gaps. There was no heat meter on the energy centre outlet, and some substation meters had crossed sensors, no power or failing batteries.
What we did
Rather than one large project, the work ran as a series of works packages, each one making the next possible: first see what the plant is doing, then measure it, then change it.
Visibility and alarms, before Christmas 2023
The first package was an emergency. With no reliable view of the energy centre and the holidays approaching, we fitted our BEMS controller with a 4G connection into the BMS panel, built live dashboards and set up automatic alarms. Working on site with a licensed BMS engineer, we changed the control strategy: we removed the frost function, made one boiler the standard, switched boiler firing to buffer store temperatures, and corrected the crossed data points and fault handling. The aim was to keep the network running reliably through the holidays, with failures reported automatically.
Metering that can be believed
We traced every bulk heat meter on site, checked each one against the BMS, swapped crossed sensors, restored power supplies and replaced a faulty meter. All the meter data was brought into dashboards, with volume weighted average return temperatures and losses calculated automatically from a dedicated database, so that every later change could be measured.
Closing the bypasses
The new dashboards showed that 24% of the primary flow was bypassing the homes. Closing a single end-of-line bypass cut network flow by about 15 m³/h, 10 to 20% of the total, at once. The riser bypasses were then closed in turn.
Reworking the buffer stores overnight
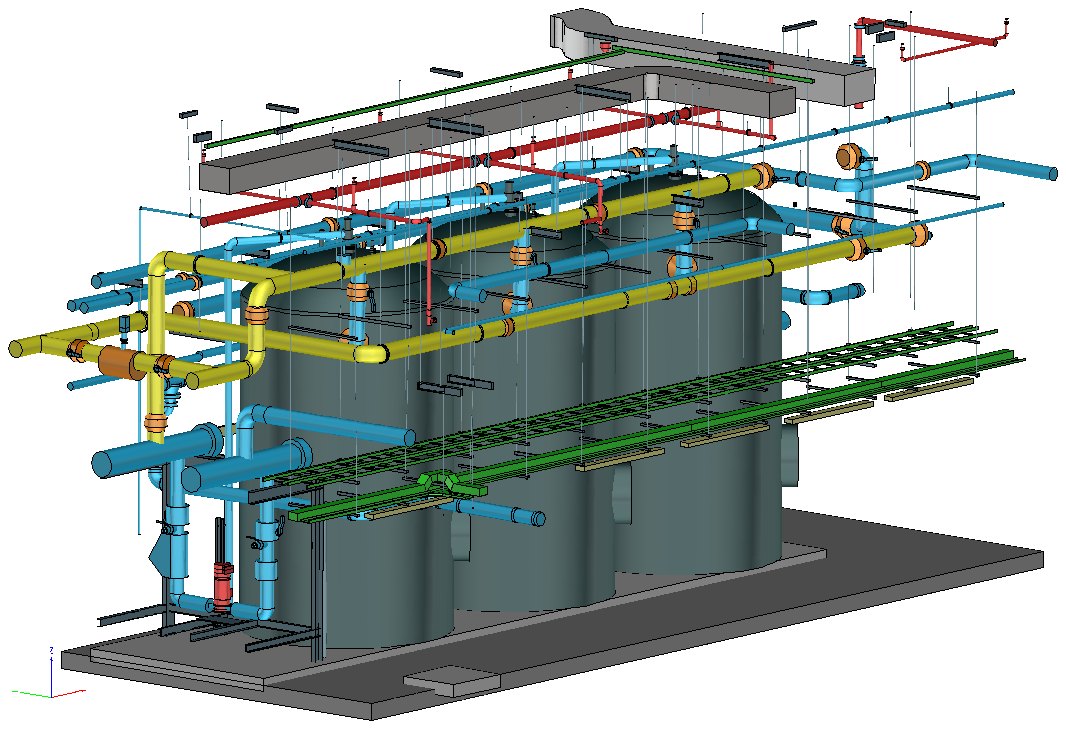
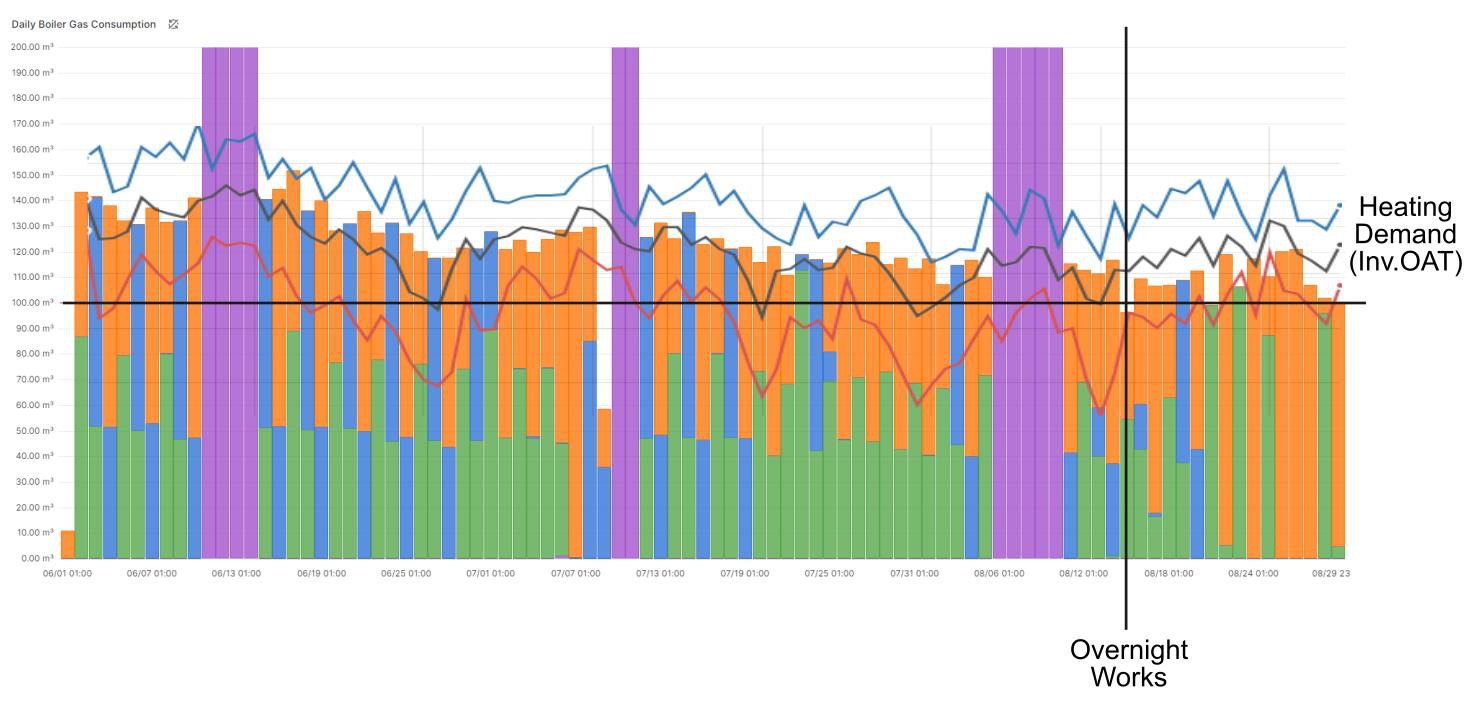
We scanned the energy centre in 3D and modelled the existing and proposed pipework before anything was quoted. The best route was to keep the buffers in parallel but add a reverse return, so that all three charge and discharge evenly, with no need to drain the stores. The whole changeover was done in one overnight shutdown in August 2024 by a team of eight, with every resident and the hotel given notice.
Boiler control
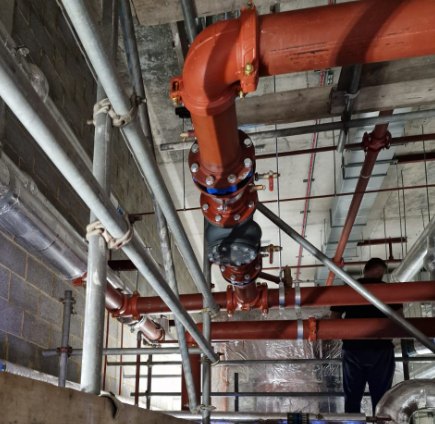
We added a loading valve function, so that the cold water in a boiler that is just starting stays in the boiler circuit instead of reaching the network, and set boilers to fire from the depletion of the buffer stores. Substation setpoints came down to 62 °C.
Finding the faulty HIUs
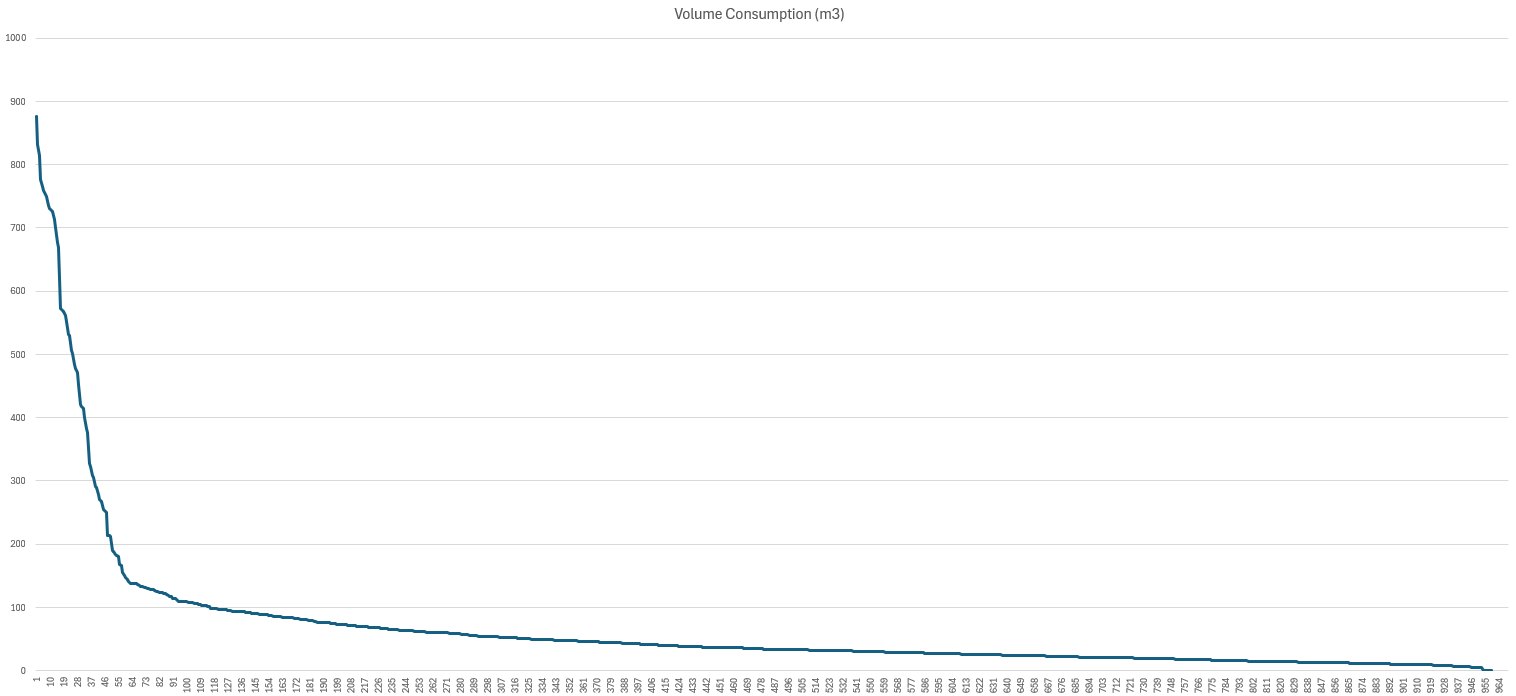
Returns were still higher than they should have been, so we analysed the meter data from every home. Five per cent of the properties accounted for 45% of all the primary water used, some drawing more than 20 times as much as a healthy home: HIUs letting water through when they should be closed. We produced a prioritised list of homes to visit, worst first.
Pumps and hot water
The secondary pumps used about 3 kW each even at minimum speed. We specified small jockey pumps for normal loads, using under 0.23 kW, a potential saving of around £10,000 a year for each pump. In 2025 we investigated hot water complaints in individual homes and traced them to thermostatic mixing valves in the HIUs jammed by debris, which were cutting hot water from 55 °C to 49 °C. Servicing the valves restored the set temperature, and showed that 50 °C setpoints work well with the showers.
The results
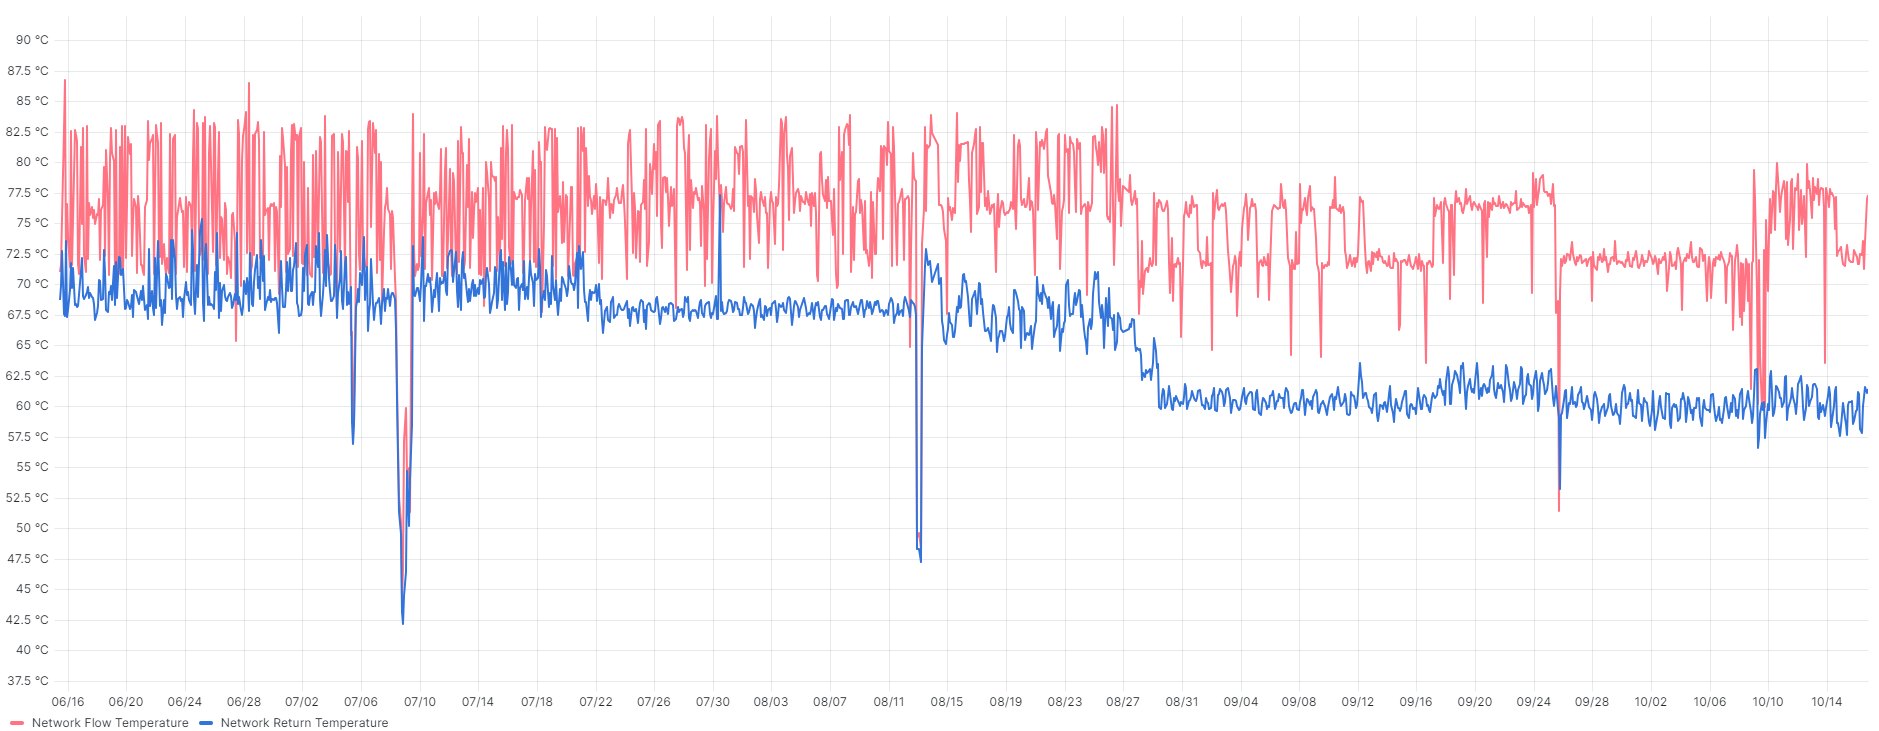
- Stable temperatures. Network flow temperature now holds at 72 °C ±1.5 °C, and the swings caused by boiler cycling are down to ±1 °C over 24 hours.
- A network that cools properly. The average temperature drop across the network rose from 6 °C to 16 °C after the buffer and boiler works, and the return temperature fell by around 9 °C.
- Less gas. Gas use dropped by an estimated 15% straight after the overnight works. Against weather-adjusted demand, we estimated the saving from the works at around 20% of the summer load: about 2.2 MWh a day, 800 MWh a year, or more than £40,000 a year.
- Over 20% saving. The meter data and feedback from users since have confirmed an energy saving of more than 20%.
What it shows
Most of what was wrong at Brunel Street could not be seen from the BMS screens, and some of what the screens showed was wrong. The turnaround came from getting reliable data first, then making changes one at a time and measuring each one. The same dashboards now let the maintenance team keep the network efficient, track its KPIs and prepare for the Heat Network Technical Assurance Scheme (HNTAS).
The monitoring and controls used here are described in our SBRI project and the BEMS 2.3 controller.