
Pre-commissioned control panel for twin plate sub-station control.
Summary
- GSM modem and SIM with fixed IP address
- Touch screen display
- Open Protocol
- Alarm reporting via email and SMS
- Node-RED controls software
- Browser based interface with dashboard and graphing
- Metal enclosure with ventilation fan, run/fault indicator lights and hand/auto switches
- Redundant control circuts
- MQTT, VPN, and HTTPS services
- Modbus Client or Master interfaces in RTU or TCP
- M-Bus Master interface optional to read heat meters
- Full controls logic with auto duty-assist-standby operation and adaptive PID control
- Pre-assembled ready for site connection to
- 2x Primary control valves (with feedback)
- 2x Circuit isolation valves
- 6x Temperature sensors
- 2x Pressure sensors
- 1x DP sensor
- 1x Primary bypass valve
For Use With
- Existing sub-stations requiring new controls
- New installations where plate heat exchangers and pipework are by installer
- Substation manufacturers requiring proven controls logic and open protocol integration
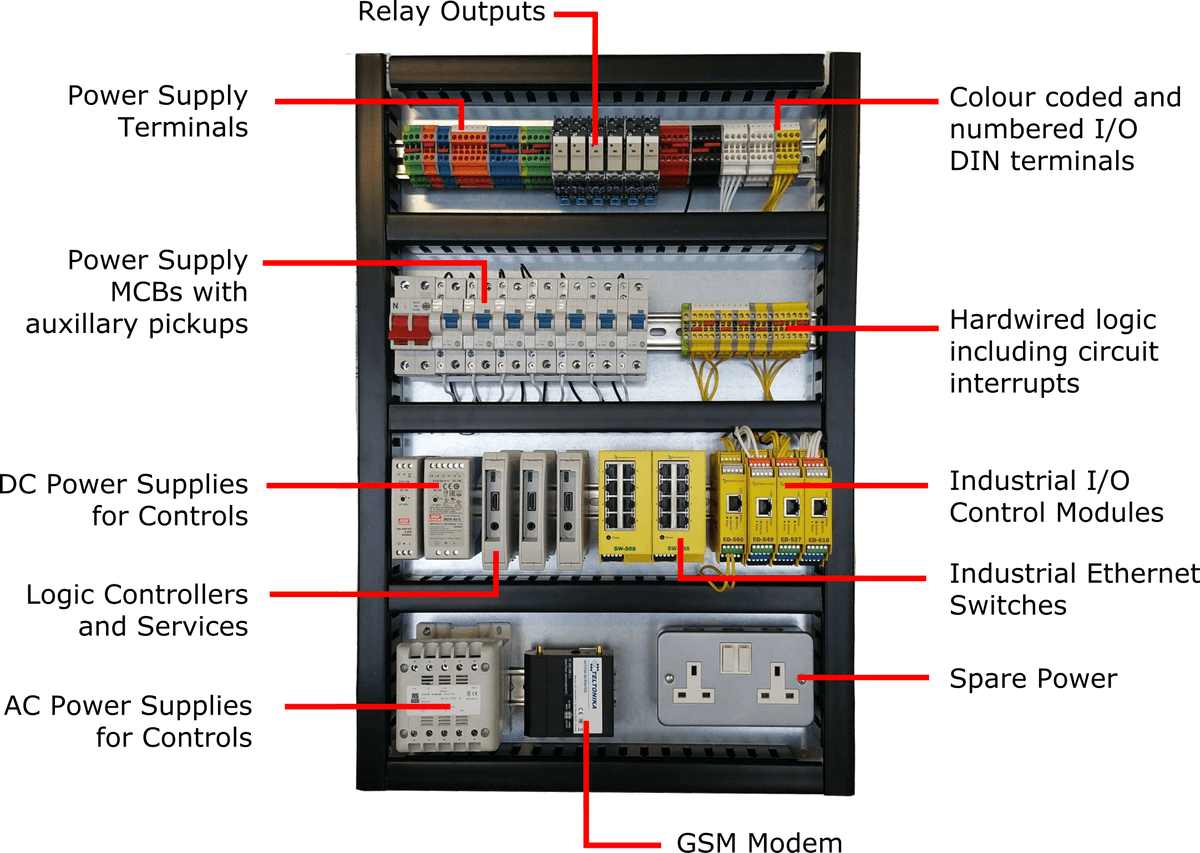
Panel Components
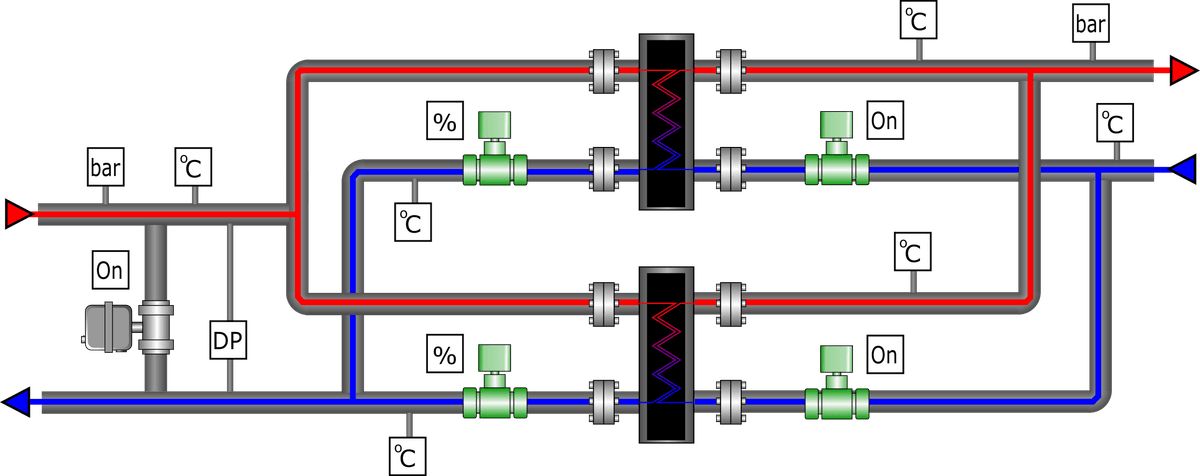
Schematic
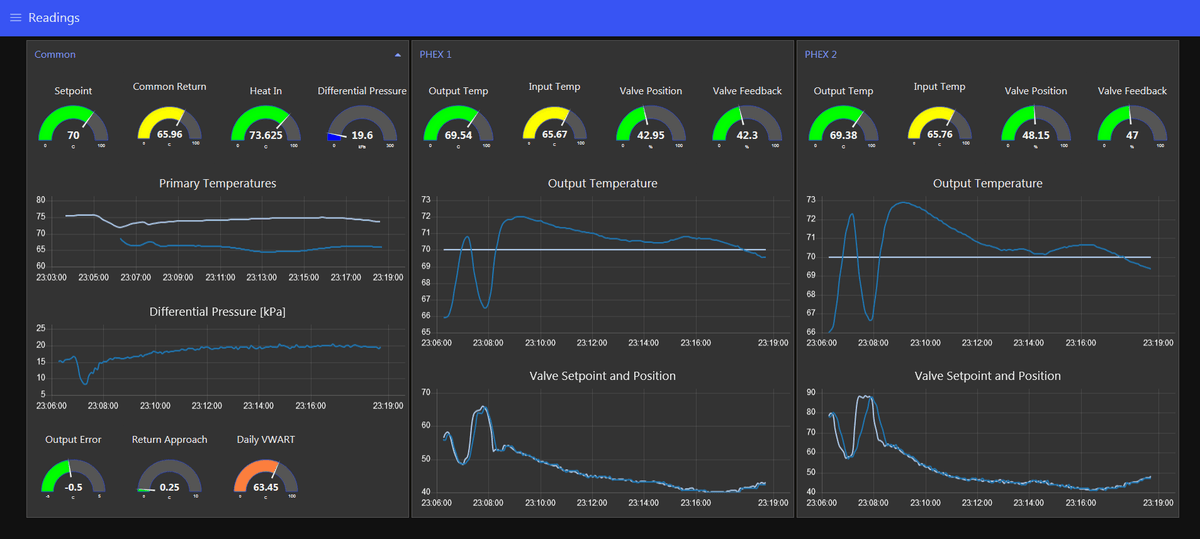
Controls Protocol
Key Metrics
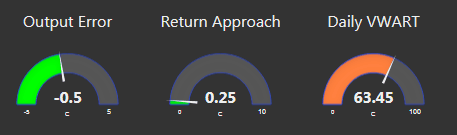
Performance of the controls system is reduced to three key metrics:
- Error Temperature - how far off target the system output temperature is. How well the controls are working.
- Return Approach - how close the primary return temperature is to the system return temperature. How efficiently the heat exchange is running.
- VWART - volume weighed average return temperature. How efficiently the overall network is running.
We would expect to see an error temperature less than 0.5C, an return approach less than 2C, and a VWART ranging from 25C in Summer to 50C in Winter or at standby.
Control Functions
Adaptive PID Control
PID control settings are altered to match the load through plate heat exchangers to account for longer response times at low flow.
Sequencing
Lead plates are rotated at regular intervals (1 week by default).
Plates are rotated when a fault is detected.
Alarms
There are two forms of alarms.
- Hard-wired alarms, such as an MCB auxiliary switch
- Software alarms, such as low temperature
Software alarms are defined using JSON notation.
{
"topic": "dat/tOut",
"devices": "phex1,phex2",
"alarms": [
{
"runonly": true,
"type": "low",
"onvalue": 50,
"minutes": 5,
"offvalue": 65,
"description": "low temperature",
"email": "admin@heatweb.com",
"sms": "",
"repeat": true
}
]
}
| key | Description |
|---|---|
| topic | The last two levels of the topic, representing the data type and key, e.g. dat/tOut |
| devices | A comma separated list of devices the alarm applies to, e.g. b1,b2 |
| alarms | An array of alarm states |
| runonly | true/false if the alarm only applies when the device is running on topic .../dat/run |
| type | low/high/age |
| onvalue | The value at which the alarm triggers |
| minutes | How long the conditions need to be active for the alarm to trigger |
| description | The alarm description, used as the output value |
| A comma separated list of email recipients for the alarm | |
| repeat | true/false if the alarm should be resent at regular intervals is triggered |
MQTT Services
The panel hosts MQTT services through a fixed IP address and provides a dashboard to manage user access to topics.
Alternatively, or in parallel, a cloud based MQTT service can be used with the panel sending data as a client.
Typically, all logic controllers also run a local MQTT service to enable communication in case central MQTT services are unavailable.
Remote Access to Dashboards
Node-RED Dashboards are not exposed to the internet, but are accessible over the internet using a secure and encrypted VPN connection.
Open-VPN client software is required on the client device (PC, tablet, phone, Raspberry Pi etc) and .ovpn files and passwords are provided with the control panel that can be imported into the client software to create a connection.
Client Side Dashboards
Node-RED Dashboards can be run on a client computer and access live data through an MQTT connection. This simplified the creation and use of custom dashboards.
As MQTT is also the standard protocol used for home automation, there are a large number of MQTT based apps available for phones and tablets. These enable one to create custom interfaces in minutes, and are the simplest way to offer a 3rd party access to specific data, alarms or commands.
The most efficient permanent dashboard installation is an HDMI screen connected to a Raspberry Pi running a Node-RED dashboard in kiosk mode (it boots into dashboard). The layout of the dashboard can be tailored to the screen resolution. A local Node-RED instance like this allows additional alarm rules and routing to be added locally.
Dashboard Creation
Dashboards can incorporate SVG elements created using Inkscape (free software).
Text, colours, and element dimensions or rotation can be linked to protocol values to rapidly create real-time dashboards. The schematic above is an example of an SVG drawing presented via the touchscreen with live values.